What does my blood pressure reading mean?
Type in the two numbers from your monitor and get a personal report: your US category, the body metrics behind it, a plan to reach target and a 7-day home log.
Blood pressure chart (US guideline)
| Category | Systolic (upper) | Diastolic (lower) | |
|---|---|---|---|
| Normal | less than 120 | and | less than 80 |
| Elevated | 120–129 | and | less than 80 |
| Stage 1 hypertension | 130–139 | or | 80–89 |
| Stage 2 hypertension | 140 or higher | or | 90 or higher |
| Hypertensive crisis range | higher than 180 | and/or | higher than 120 |
| Low blood pressure | less than 90 | or | less than 60 |
Categories of the 2017 ACC/AHA guideline. Browse readings by systolic value →
Blood pressure guides
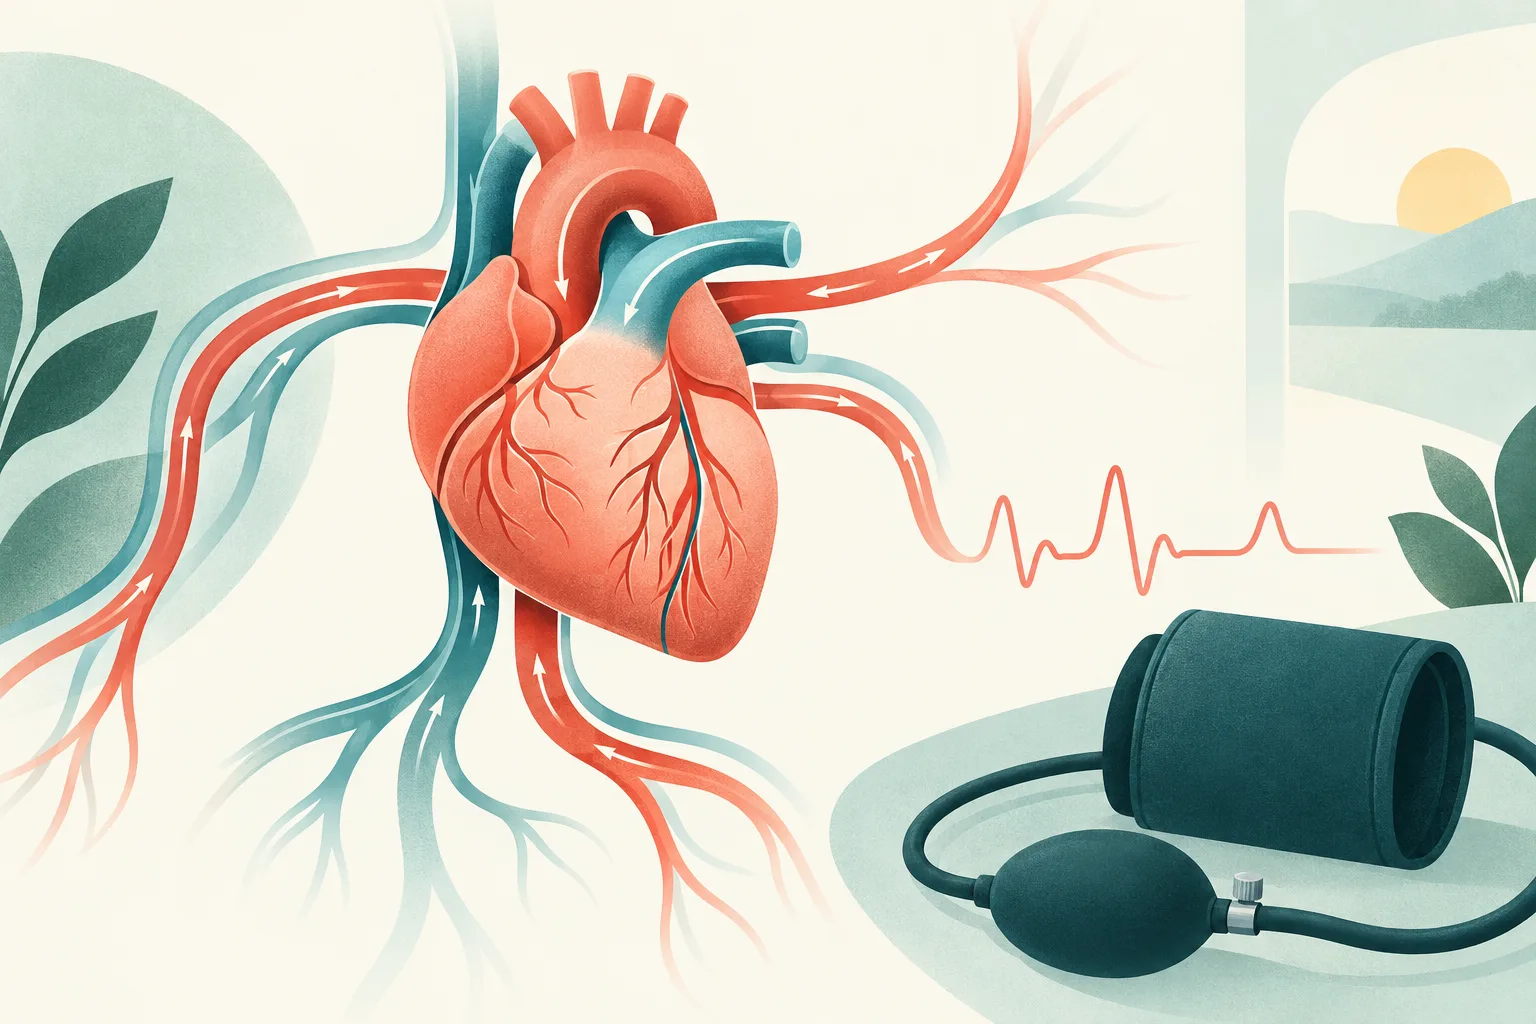 Blood Pressure Explained: Numbers, Categories, Risks
 How to Check Your Blood Pressure at Home
 How High Blood Pressure Is Diagnosed
 Effects of High Blood Pressure on the Body
 Blood Pressure Medication: The Main Types Explained
 Home Remedies for High Blood Pressure That Work
 Diet for High Blood Pressure: The DASH Plan
 5 Foods That Help Lower Blood Pressure
 Low Blood Pressure: 5 Foods and Habits That Help
 High Blood Pressure During Pregnancy
More body & health research
Heart, kidneys & hydration
Nutrition
What your numbers measure
The peak pressure each time your heart contracts. It rises as arteries stiffen with age and is the stronger predictor of stroke and heart attack after about 50.
The pressure that remains while the heart refills. A raised diastolic value is more typical of younger adults and often the first number to climb.
Every reading report also shows the mean arterial pressure (what your organs "feel") and the gap between the numbers, a window into artery elasticity.
Every reading report includes a personal "path to target" planner and a printable 7-day home log. Start with blood pressure explained.